
When traders study price action, they often search for recurring shapes that help them read the market’s next move. These formations, widely known as chart patterns, appear in every trading class—from forex to stocks to commodities. But many traders still don’t understand why their entries feel mistimed or why they continue to chase the market’s rhythms. Since such patterns recur over time, they help identify key entities such as trend strength, momentum shifts, and trend reversals. Additionally, many traders use the most successful chart patterns to enter and exit trades in an organised way.
However, the one big issue is that there are so many of them that evaluating and mastering strategies is daunting. To keep it simple, this guide breaks down 9 of the most successful chart patterns used by pros everywhere and explains why they work (or don’t) and how to utilize them in the context of real-world trading, but first, learn why these matter.
Why the Most Successful Chart Patterns Matter
If you hope to become a profitable trader, you’re going to have to learn to embrace chart patterns. They serve as road signs for an inquisitive crowd of traders, drawn to deals or worried about the market’s unpredictable nature, especially its potential hostility. They are more than just symbols and lines; in a sense, they are the standard language of the financial markets. Whether you are trading stocks, cryptocurrency, or forex, having an accurate reading of these patterns can help you immensely.
Knowing the top chart patterns helps you figure out what to do next. And it’s literally like being in possession of a map when everyone else is just guessing. They reduce noise and highlight areas where buyers or sellers are gaining control. Additionally, they help traders form expectations based on past behavior, even though no pattern guarantees future performance. When used with volume, support and resistance, and a clear risk plan, most successful chart patterns can sharpen a trader’s edge in volatile markets.
1. Head and Shoulders Pattern
Head and shoulders is one of the most successful chart patterns because it clearly indicates a dying trend. It is composed of 3 peaks: a central middle peak (the head) and two outer lower peaks (the shoulders) on both sides. Beneath them sits a neckline, marking support. Sentiment frequently shifts from bullish to bearish when the price breaks below the neckline and the last shoulder fails to push higher.
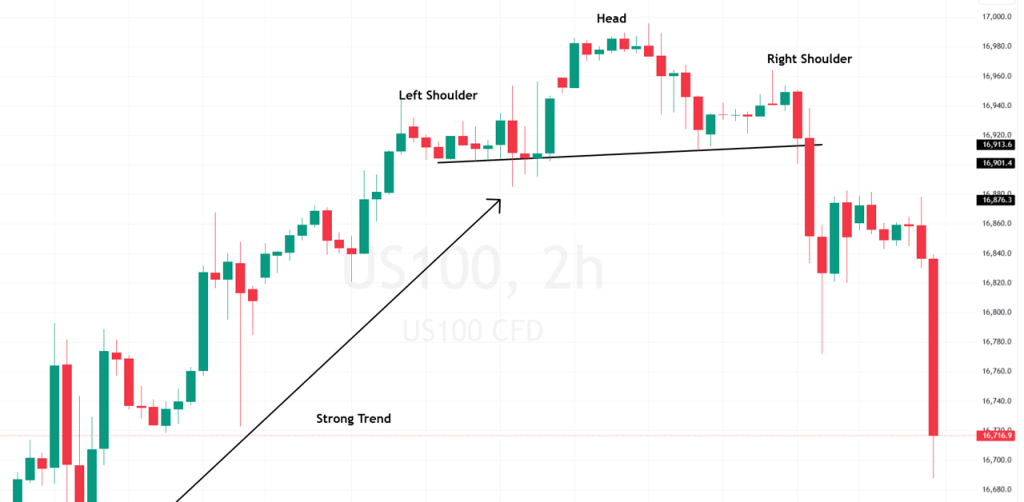
Despite the structure’s seeming simplicity, traders recognize its value in technical analysis because it offers a dependable signal for trend reversals and organized, clear information for managing trades, such as exact entry points, stop-loss levels, and profit targets. Thus, rightly, it takes place here among the most successful chart patterns.
2. Double Top
A double top is yet another trusted signal pattern that typically signals the end of an uptrend and the beginning of a downtrend, and this is why it is on the list of the most successful chart patterns. It is a pattern that shows up when the market reaches a peak, pulls back and then tries to climb again — only to fail at about that level. The repeated rejection shows strong selling interest.
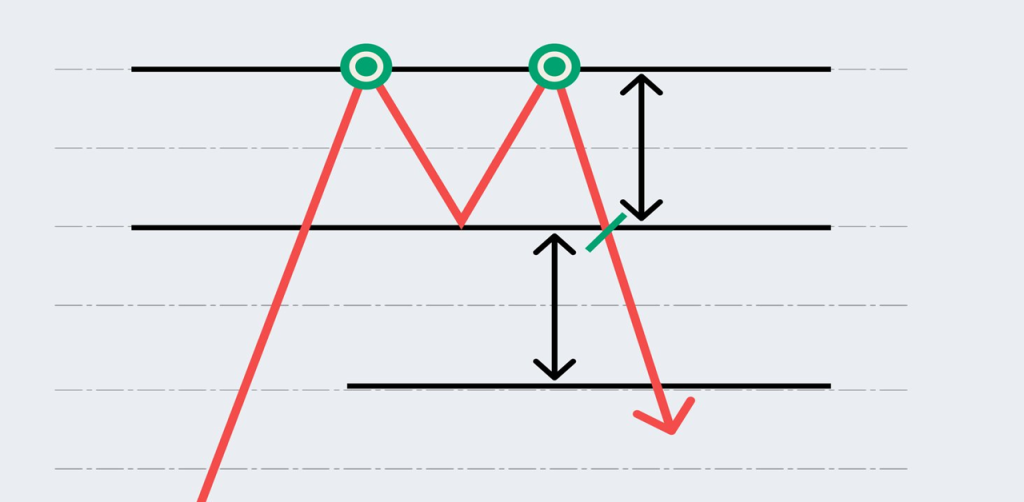
The pattern creates an “M” shape. Once the price falls below the low between the two tops, many traders consider the market vulnerable to a deeper drop. Furthermore, double tops often appear after strong rallies, offering a natural pause before a reversal sets in.
3. Double Bottom
The double bottom is almost the opposite of the double top pattern. It makes our list of the most successful chart patterns and forex patterns, owing to its success rate when identifying exhaustion in a downtrend. In this, the price touches a low, rallies, touches that same low again, and then takes off with added buying pressure.

It creates a “W” shape. As the price finally bursts through the midpoint high, traders typically interpret this as evidence that selling activity has subsided and a new bullish market has begun. Also, double bottoms usually form when the markets are already oversold, and thus more likely to reverse.
4. Ascending Triangle
The ascending triangle is a bullish continuation pattern and one of the most successful chart patterns for trend traders. It forms through rising lows pressing against a flat line of resistance. This pressure suggests buyers are steadily gaining strength.
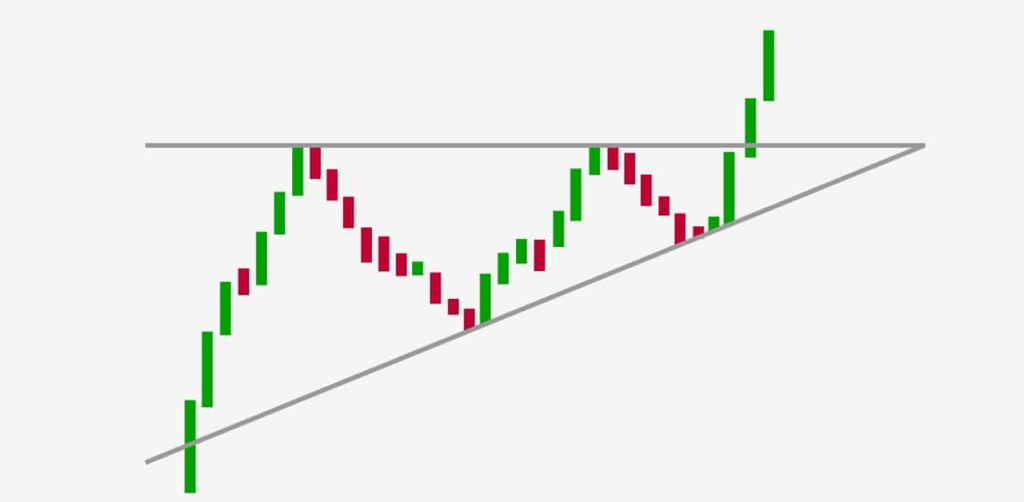
When the price finally breaks above the horizontal resistance, the move often sparks renewed bullish energy. Many traders watch volume during the breakout. Increased activity adds confidence that the upward move has conviction.
5. Descending Triangle
A descending triangle is a bearish chart pattern in technical analysis formed by drawing a trend line connecting a series of lower highs and another connecting a series of lower lows. It indicates increased aggressiveness on the part of sellers, and buyers are shown to step up at the same level of support, leading to a tightening price range. The pattern is typically a continuation signal and implies that the downtrend will continue with the price breaking out below the support level.
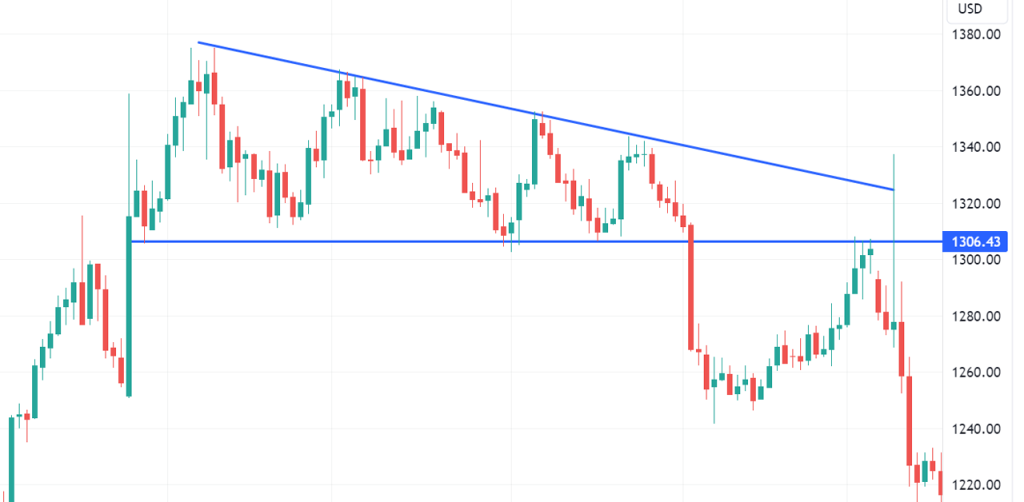
As sellers repeatedly test support, pressure builds. Should the price break below the horizontal line, the downtrend often accelerates. Moreover, the descending triangle highlights one powerful idea: persistent sellers often win if buyers cannot lift the market. It makes the list of our most successful chart patterns because it helps everyday traders visualise when sellers are gaining control and likely to push prices down further.
6. Symmetrical Triangle
Among the most successful chart patterns, the symmetrical triangle really grabs attention in technical analysis. It shows up when the market can’t quite make up its mind—buyers and sellers push back and forth, and prices get squeezed tighter and tighter between two converging lines. The top line traces a series of lower highs, while the bottom one marks higher lows, so the price just coils up, building tension.

During this time, neither side really takes control. You end up with a sort of standoff until the price finally breaks out—up or down, no middle ground. At that point, traders jump in, especially if they see a spike in volume confirming the move. These triangles work even better when they line up with the overall trend, since breakouts usually keep going in the same direction. All in all, a symmetrical triangle hints that the market’s gearing up for a big move. Once the indecision ends, things can get interesting fast.
7. Cup and Handle
The cup and handle pattern is considered one of the most successful chart patterns for spotting long-term bullish setups. It forms a rounded “cup” followed by a brief pullback—the “handle”. This pullback often occurs as traders take profits before a stronger breakout.
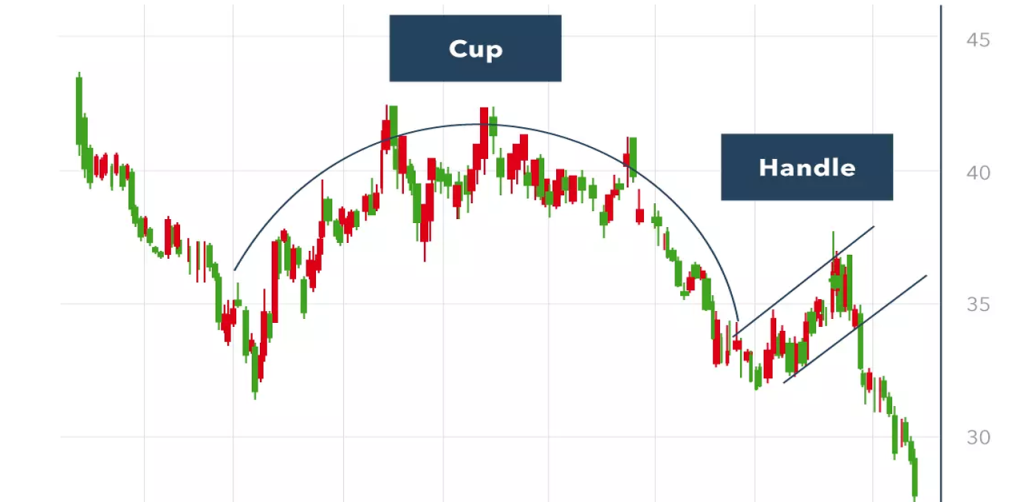
The appeal of this pattern lies in its psychology. Buyers return repeatedly at slightly higher levels, showing faith in the trend. Once the price breaks above the handle, an extended rally is often possible. Moreover, the curved structure reflects healthy consolidation rather than panic selling.
8. Flag Pattern
The Flag Pattern appears frequently and is part of our most successful chart patterns list due to its simplicity and consistency. A flag begins with a sharp price movement called the “pole”, followed by a brief consolidation phase shaped like a small rectangle or parallelogram.
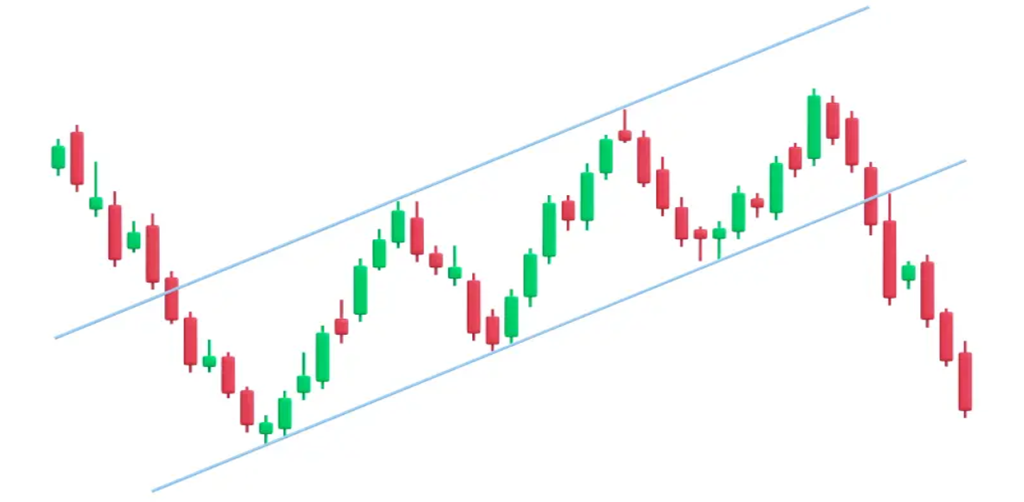
Bullish flags angle downward or sideways (consolidating temporarily against the uptrend), while bearish flags angle upward or sideways (consolidating temporarily against the downtrend). The breakout usually continues sharply in the direction of the pole. Because of their short duration, flags are popular among active traders seeking clean continuation signals. Additionally, volume often contracts during flag formation and spikes significantly on the breakout, which improves confidence in the signal.
9. Wedge Pattern
Wedges—up or down—are so common among the best chart patterns primarily because they show momentum topping well before the market ever acknowledges it. A rising wedge occurs as an asset rallies; the highs and lows are trending closer together, indicating that buyers are growing weaker, and a bearish reversal could be in development. A falling wedge works in the opposite way. It starts wide, narrows as the price slides, and often signals that sellers are tiring and a bullish shift may be close.

What traders like about wedges is the tension they build. The swings get smaller, the chart tightens, and the market feels ready for a decisive break. When that break comes, the move can be quick. The smaller peaks and troughs inside the pattern help confirm weakening pressure and reflect the crowd’s changing mood.
Common Mistakes Traders Make With Chart Patterns
Many traders understand chart formations but still struggle because of a few recurring mistakes. One common error is entering too early. A pattern may appear complete, but without a confirmed breakout, it can fail and trap traders on the wrong side. Ignoring the broader market context is another major error. A reliable setup can lose its edge if conditions are highly volatile or driven by major news events. Traders also overlook stop-loss placement, assuming the pattern “must work”, which exposes them to unnecessary risk.
Additionally, overconfidence creates problems. Some rely on a single formation without checking volume, trend strength, or confluence signals. Avoiding these mistakes strengthens your technical approach and improves decision-making. Using the stated 9 most successful chart patterns, you can certainly increase your chances of earning higher profits.
Conclusion
As stated already, being able to identify the most successful chart patterns provides traders with better insight into the markets. The aforementioned 9 types of trading chart patterns, when used in combination with disciplined execution, careful risk control, and patience, can help traders navigate fast-moving charts with greater confidence.
At the same time, reading and understanding these most successful chart patterns thoroughly refines your abilities, and you start to recognize how market structure shapes real trader behavior, rather than simply random lines on a chart. Given enough time, this reflex will grow into responding with thought rather than reaction – and this is the defining line between traders who consistently profit and those at the whim of their emotions. And as your technical skills expand, trading with a proven ECN broker, such as Xtreme Markets, can help you get quicker with your decision-making and provide you with cleaner access to the trades you make.