Traders know that the markets move fast. Assets’ prices spike, then crash – when traders try to make sense of this, they get tangled in mixed messages. To trade without second-guessing, you need better than a jumble of red and green bars flashing everywhere. What works? Clear vision. Using a Heikin Ashi Candle (HA) is useful in this situation. These eliminate distractions and make real patterns stand out instead of responding to every little movement. Switching to HA candles brings sharper focus. Rather than getting caught up in tiny price jumps, these smooth out distractions so you spot actual movement more easily.
More, if you use regular candles? It can be super shaky—they can be one up one moment, then suddenly goes down. Just watching them makes you dizzy. But Heikin Ashi smooths out the mess. Out of nowhere, spotting trends gets way easier—seeing if they’re building up, fading away, or when you should jump in. Doesn’t it all sound interesting? It is. This guide breaks down how Heikin Ashi candles work and what their signals mean and also shows ways to boost your trades using them.
What Is a Heikin Ashi Candle?
Heikin Ashi, which means “average bar” in Japanese, is a technique that blends highs, lows, and closes into a single flow to smooth price action. Since HA candles hold their color longer—that is, they can actually follow the trend—instead of standard candles, which have tiny swings that quickly change color, this version filters noise to make market trends easier to understand.
Here’s what makes them stand out:
- They smooth out market noise by averaging prices together.
- They make it easier to spot big trends and quick reversals.
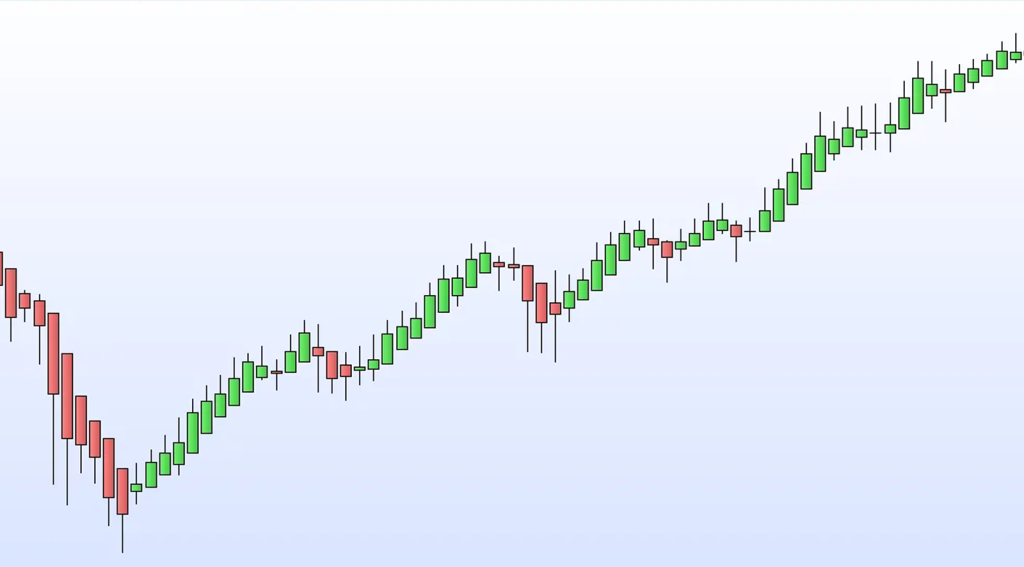
- Green HA candles mean upward movement; on the flip side, red ones suggest downward pressure.
You can try these anytime—like every day, each hour, or just by the minute.
If you’re sick of jumping at each tiny market flicker orsmall movement, HA candles let you see what really matters instead. They’re perfect for traders who want to follow trends instead of panicking over every tick.
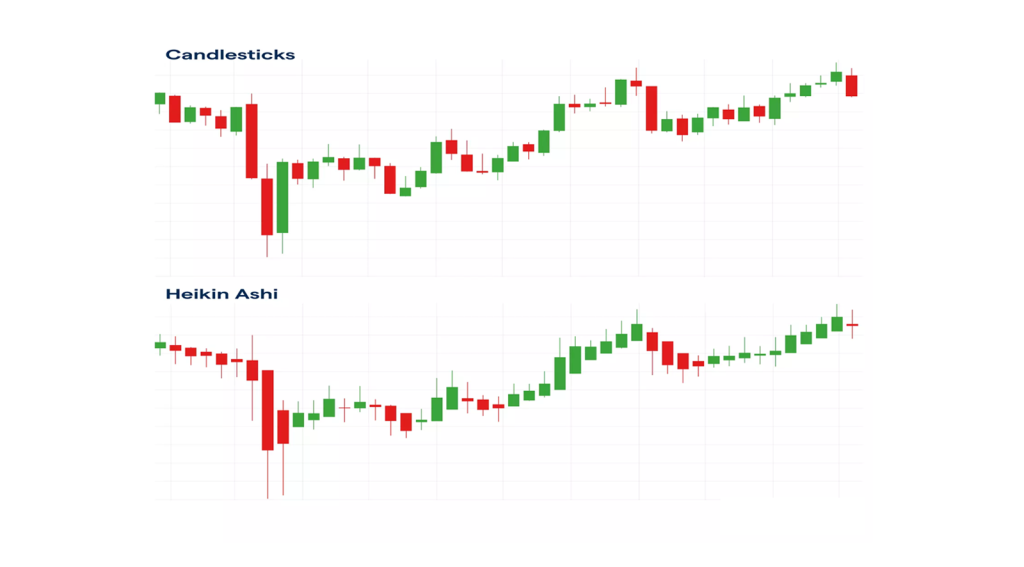
Comparison Heikin Ashi candle Chart vs. Candlestick Chart
A HA chart looks very similar to a candlestick chart, but each bar is calculated using a different formula. HA charts use averages to show price moves. That smooths out the wild swings you’ll see on regular candlestick charts. Open, high, low, and close are the four price points that are displayed in both types. The big difference? HA uses past data to calculate each candle, not just the current period.
Similarities:
- Both of them show the open, high, low, and close and look similar, except each bar is calculated differently.
- They both function on every time frame—perfect if you’re flipping trades fast, trading daily, OR holding positions longer.
- They both let you see shifts, changes, or repeated movements and trends—though spotting them works a bit differently each time.
Differences:
- Regular candles use actual prices for each period. HA candles blend data from the current and previous periods to create each candle.
- Heikin Ashi Candle charts look smoother and less choppy—trends pop out naturally. Candlestick charts can look messy, with a lot of unpredictability and sometimes chaotic, sharp moves.
- HA makes trends and reversals easier to see, while candlesticks are better for pinpointing exact prices.
A lot of traders use both. They’ll check HA chart for trend direction, then switch to candlesticks to time their entries and exits.
How Do You Calculate a Heikin Ashi Candle?
The formula’s simple, but it works differently from standard candles. Each HA candle blends prices from the current and previous periods.
- Open: (Open of previous HA candle + Close of previous HA candle) ÷ 2
- Close: (Open + High + Low + Close of current period) ÷ 4
- High: Take the highest value among the current period’s high, HA open, and HA close
- Low: Take the lowest value among the current period’s low, HA open, and HA close
By averaging things out, you get a chart that’s much cleaner, so trends and possible reversals stand out.
How to Read a Heikin Ashi Candle Chart
Once you get the hang of it, reading HA candles is straightforward. Here’s what to watch for:
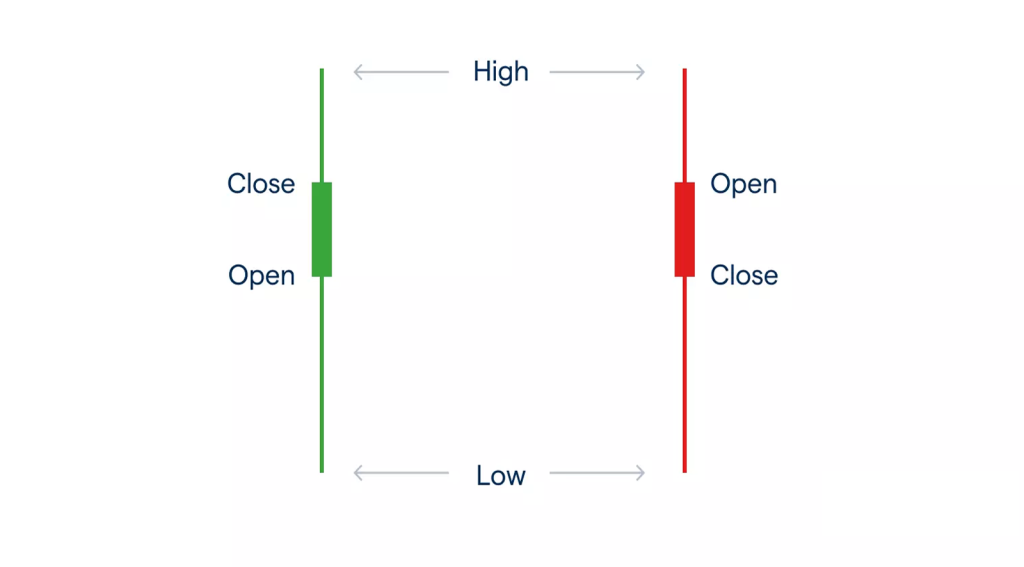
Colors:
- Green (or white) means the close is higher than the open—bullish.
-Red (or black) indicates a bearish close that is lower than the open.
Body and Wicks:
- Long green candle with no lower wick? That’s a strong uptrend.
- Long red candle with no upper wick? Strong downtrend.
- Small body with wicks on both ends? The market is undecided or getting ready to turn.
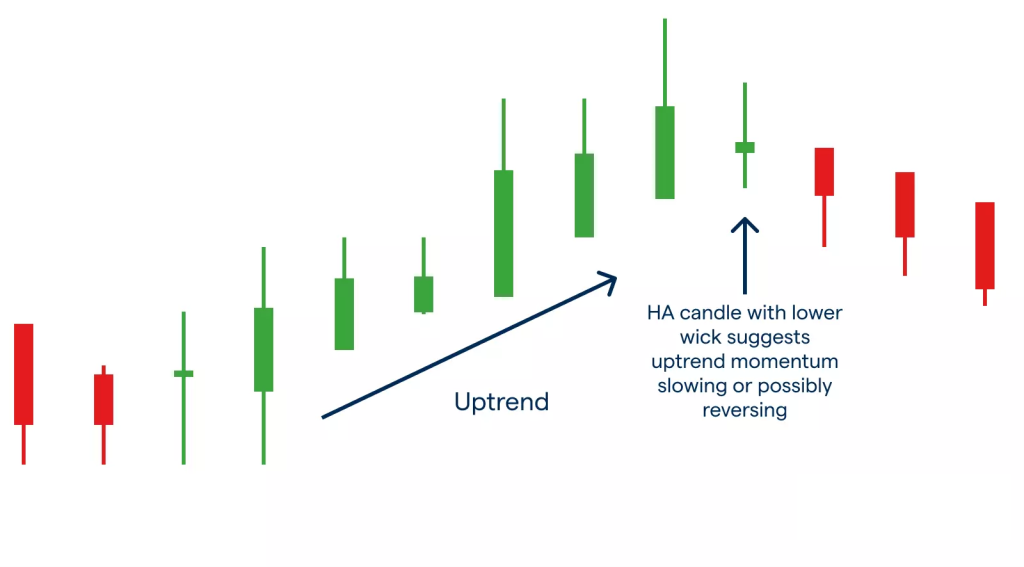
Trend Confirmation:
- Several green candles in a row? Uptrend’s going strong.
- Several red candles? Downtrend’s holding.
- Wicks start to show up after a trend? The move might be losing steam.
Understanding these signals can help you avoid jumping into trades too early—or bailing too soon. With Heikin Ashi Candle chart analyses , you get a clearer read on what the market’s really doing, so you can make smarter, more confident decisions.
Heikin Ashi Candle Patterns
Such charts stand out because they make trends easier to read. Here’s what to look for:
- Strong uptrend? You’ll see long green candles with no lower shadows. The market’s pushing higher, with barely a pause.
- Strong downtrend? It’s the opposite—long red candles, no upper shadows. Sellers are in control.
- If you spot small-bodied candles with wicks on both ends, the trend’s running out of steam. Momentum’s fading.
- A price shift occurs when green bars quickly turn red, or when the opposite happens. This signals that momentum is flipping around now.
- You could spot a doji-style shape – tiny body, shadows above and below. It often signals market uncertainty. Many traders pause instead of jumping in, waiting for clearer signals.
- Looking at these setups gives clues on when to jump in, stay put, or step away from a trade opportunity.
Heikin Ashi Candle Trading Strategies
Heikin Ashi candles are popular among trend traders because they filter out the noise and highlight momentum. Here’s how to use them:
1. Trend Following
See a long green candle without a lower wick? That’s a strong bullish signal. Hang on to your long positions and let the profits run. If you catch a long red candle without an upper wick, the bears are in charge—a good time to short.
2. Spotting Trend Reversals
When the candles shrink and grow wicks on both ends, the market’s unsure. That often means the trend’s losing strength and could flip soon. Time to think about closing or reversing your trade.
3. Combining with Technical Indicators
Don’t just rely on Heikin Ashi Candle alone. Layer in other tools:
- Moving Averages confirm which way the market’s leaning.
- RSI points out when things are overbought or oversold.
- ADX (Average Directional Index, ) tells you how strong the trend actually is.
- Bollinger Bands help you spot volatility and reversals.
Say you see a streak of green HA candles and the RSI is in oversold territory—that’s a high-probability buy signal.
4. Using Heikin Ashi in Derivative Trading
HA charts shine in derivatives and CFDs. They lay out the trend clearly, so you can speculate on price swings without owning the asset.
Advantages of the Heikin Ashi Candle chart
- Smoother trends:- averaging cuts down on market noise, so you see the big picture.
- Clear signals:- it’s obvious when bulls or bears are in control.
- Less false alarms:- there are fewer false alarms because HA candles change color more slowly than standard candlesticks.
- Versatility:- It can be used for day trading, going long, or scalping.
- Quick trend confirmation:- you can spot trend direction at a glance.
Limitations of the Heikin Ashi Candle chart
- HA candles don’t always match the current market price.
- Not great for lightning-fast trades—big moves might not show up right away.
- Best used with other tools—don’t trade off HA candles alone if you want accuracy.
Knowing the aforementioned limitations keeps you from placing too much trust in them and promotes caution and careful consideration.
Tips for trading with Heikin Ashi candles:
- Continue trading with your planned strategy until you notice a definite reversal or the candle changes color.
- Look at different timeframes to weed out false signals.
- Set stop-losses and manage your position size—don’t skip this part.
- Avoid messy, sideways markets. Heikin Ashi shines when the market’s actually moving.
Conclusion
Heikin Ashi candles are a simple but powerful way to spot trends, catch reversals, and make better trading decisions. They smooth out the noise, so you get a clearer read on what the market’s really doing. Mix them with other indicators like moving averages, RSI, and ADX, and you’ve got a solid strategy for any market.
Platforms like ours, Xtreme Markets, make it easy to put these methods to work by showing you several types of charts and indicators via modern trading platforms, whether you’re a beginner or a pro. No matter your style—scalping, day trading, or holding for the long haul—mastering HA candles gives you a real edge in the market.